Understand How Europe Votes
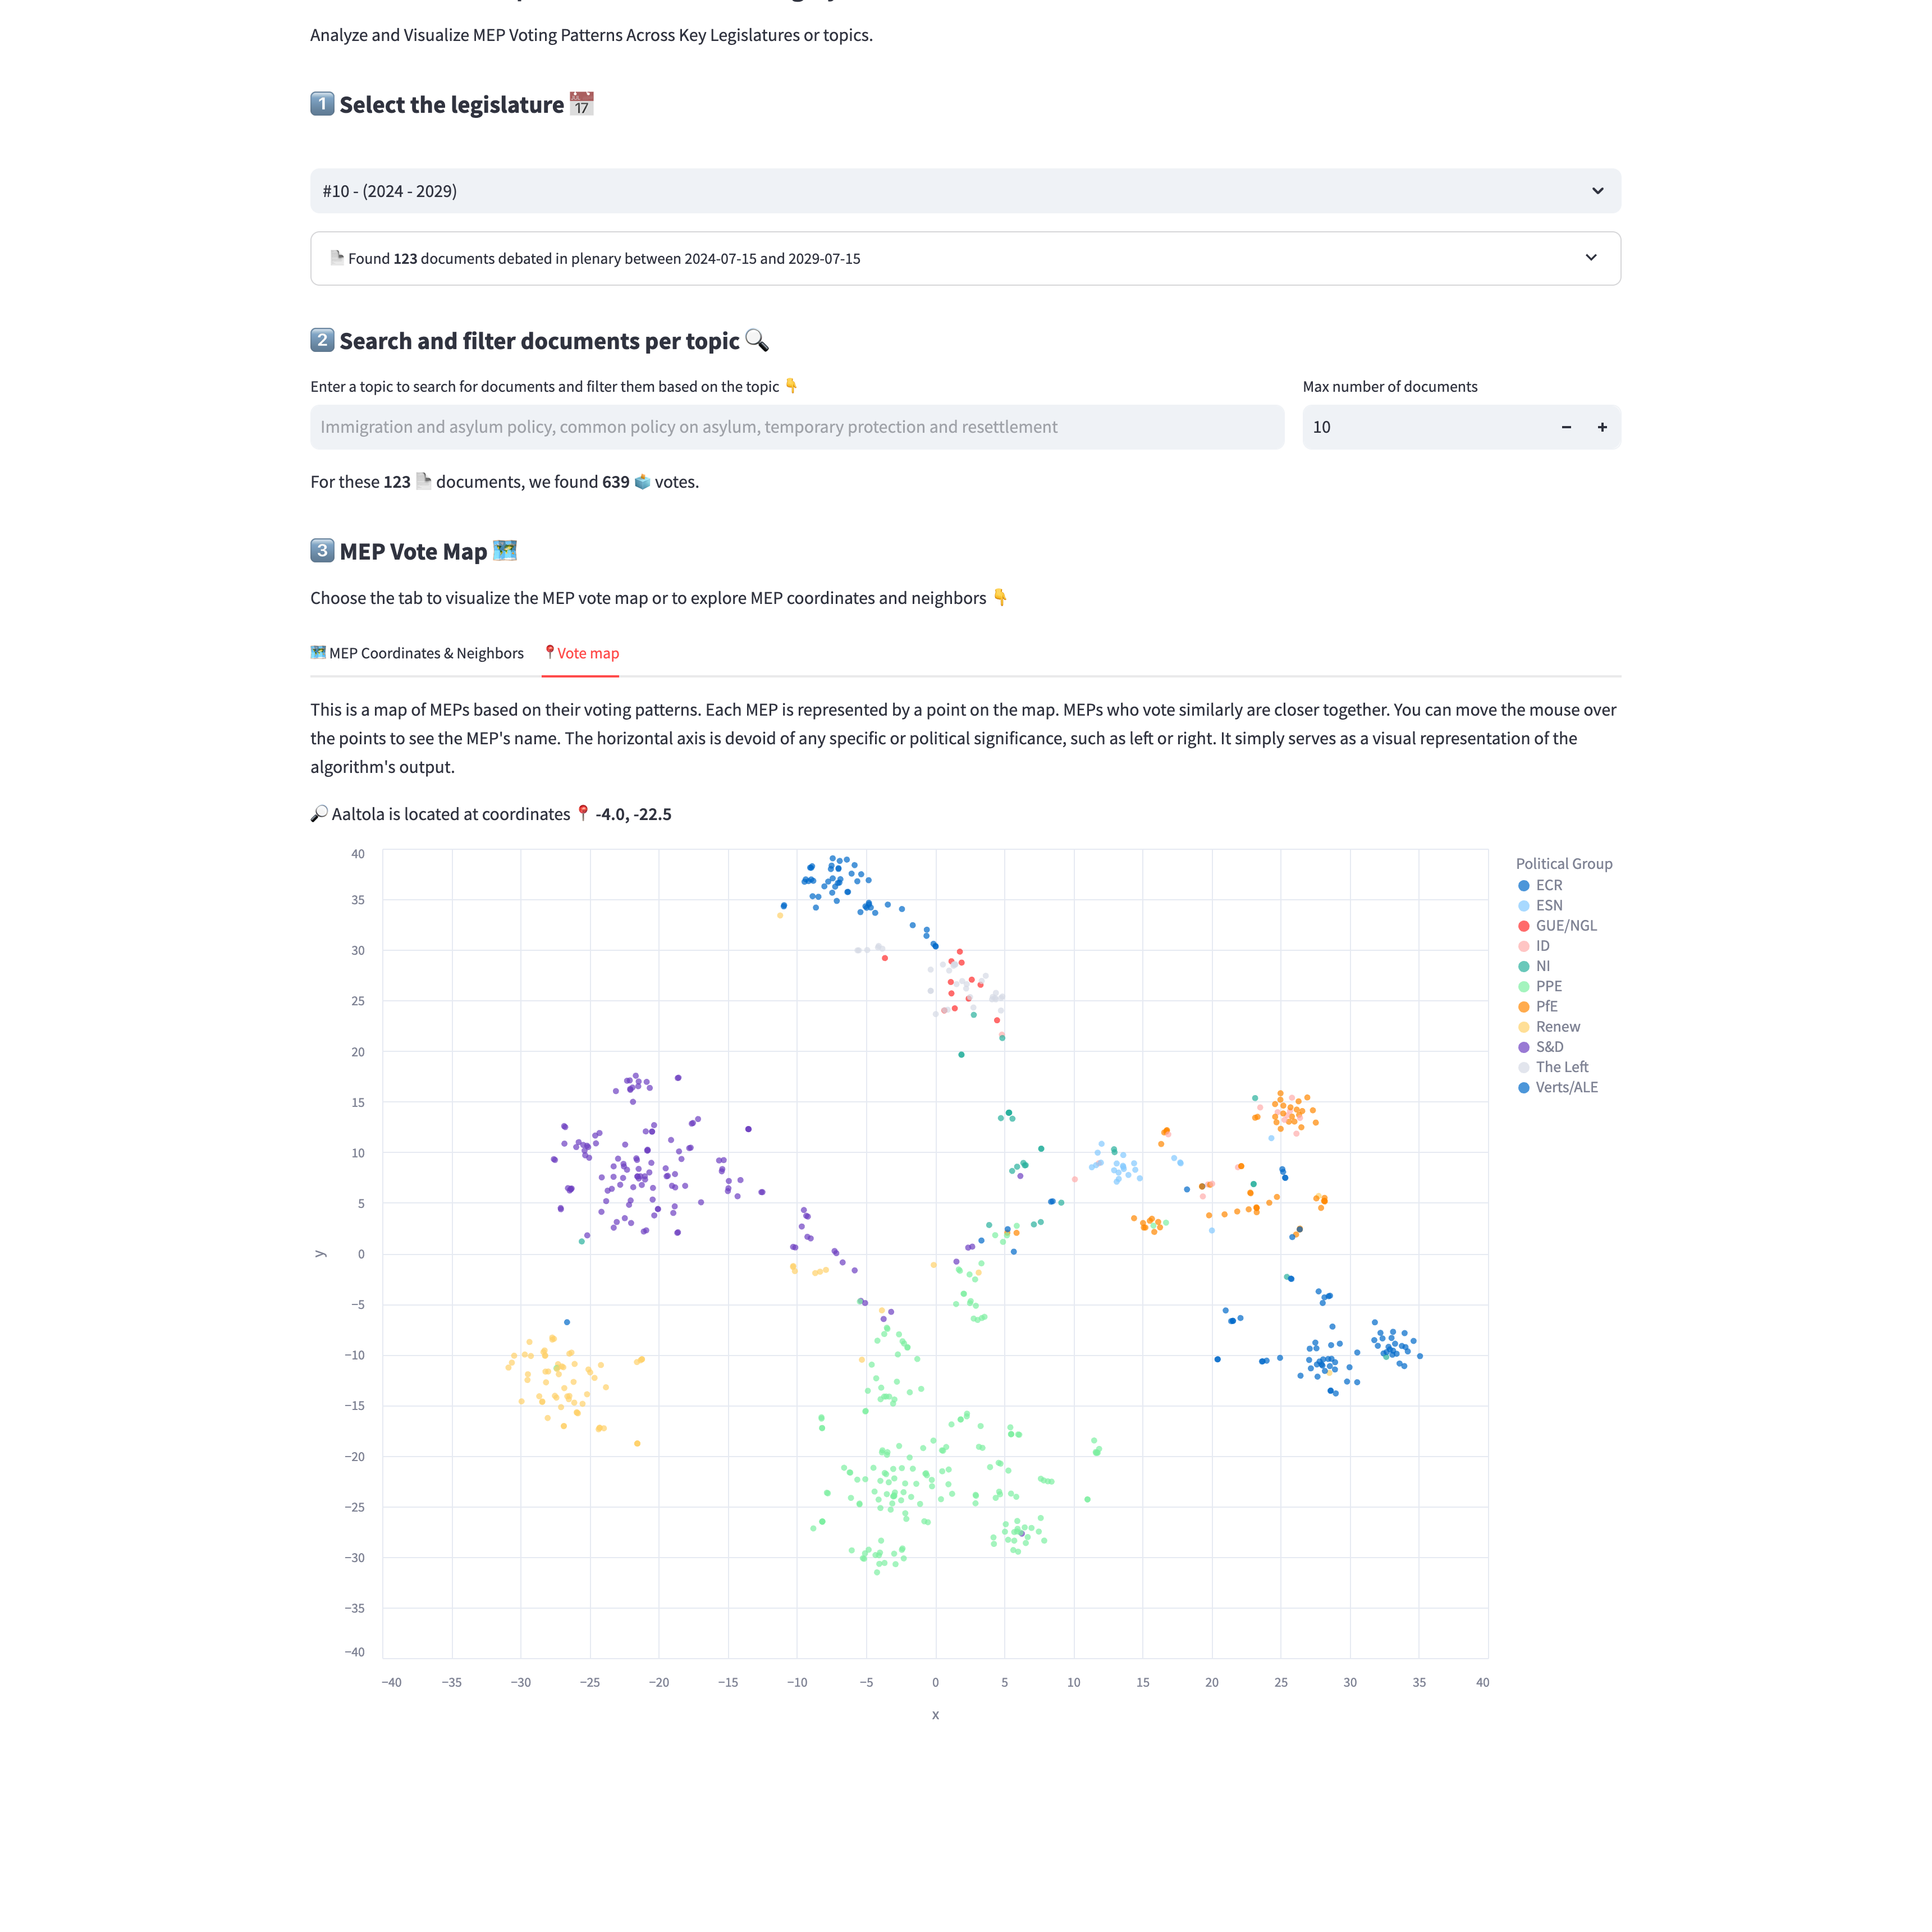
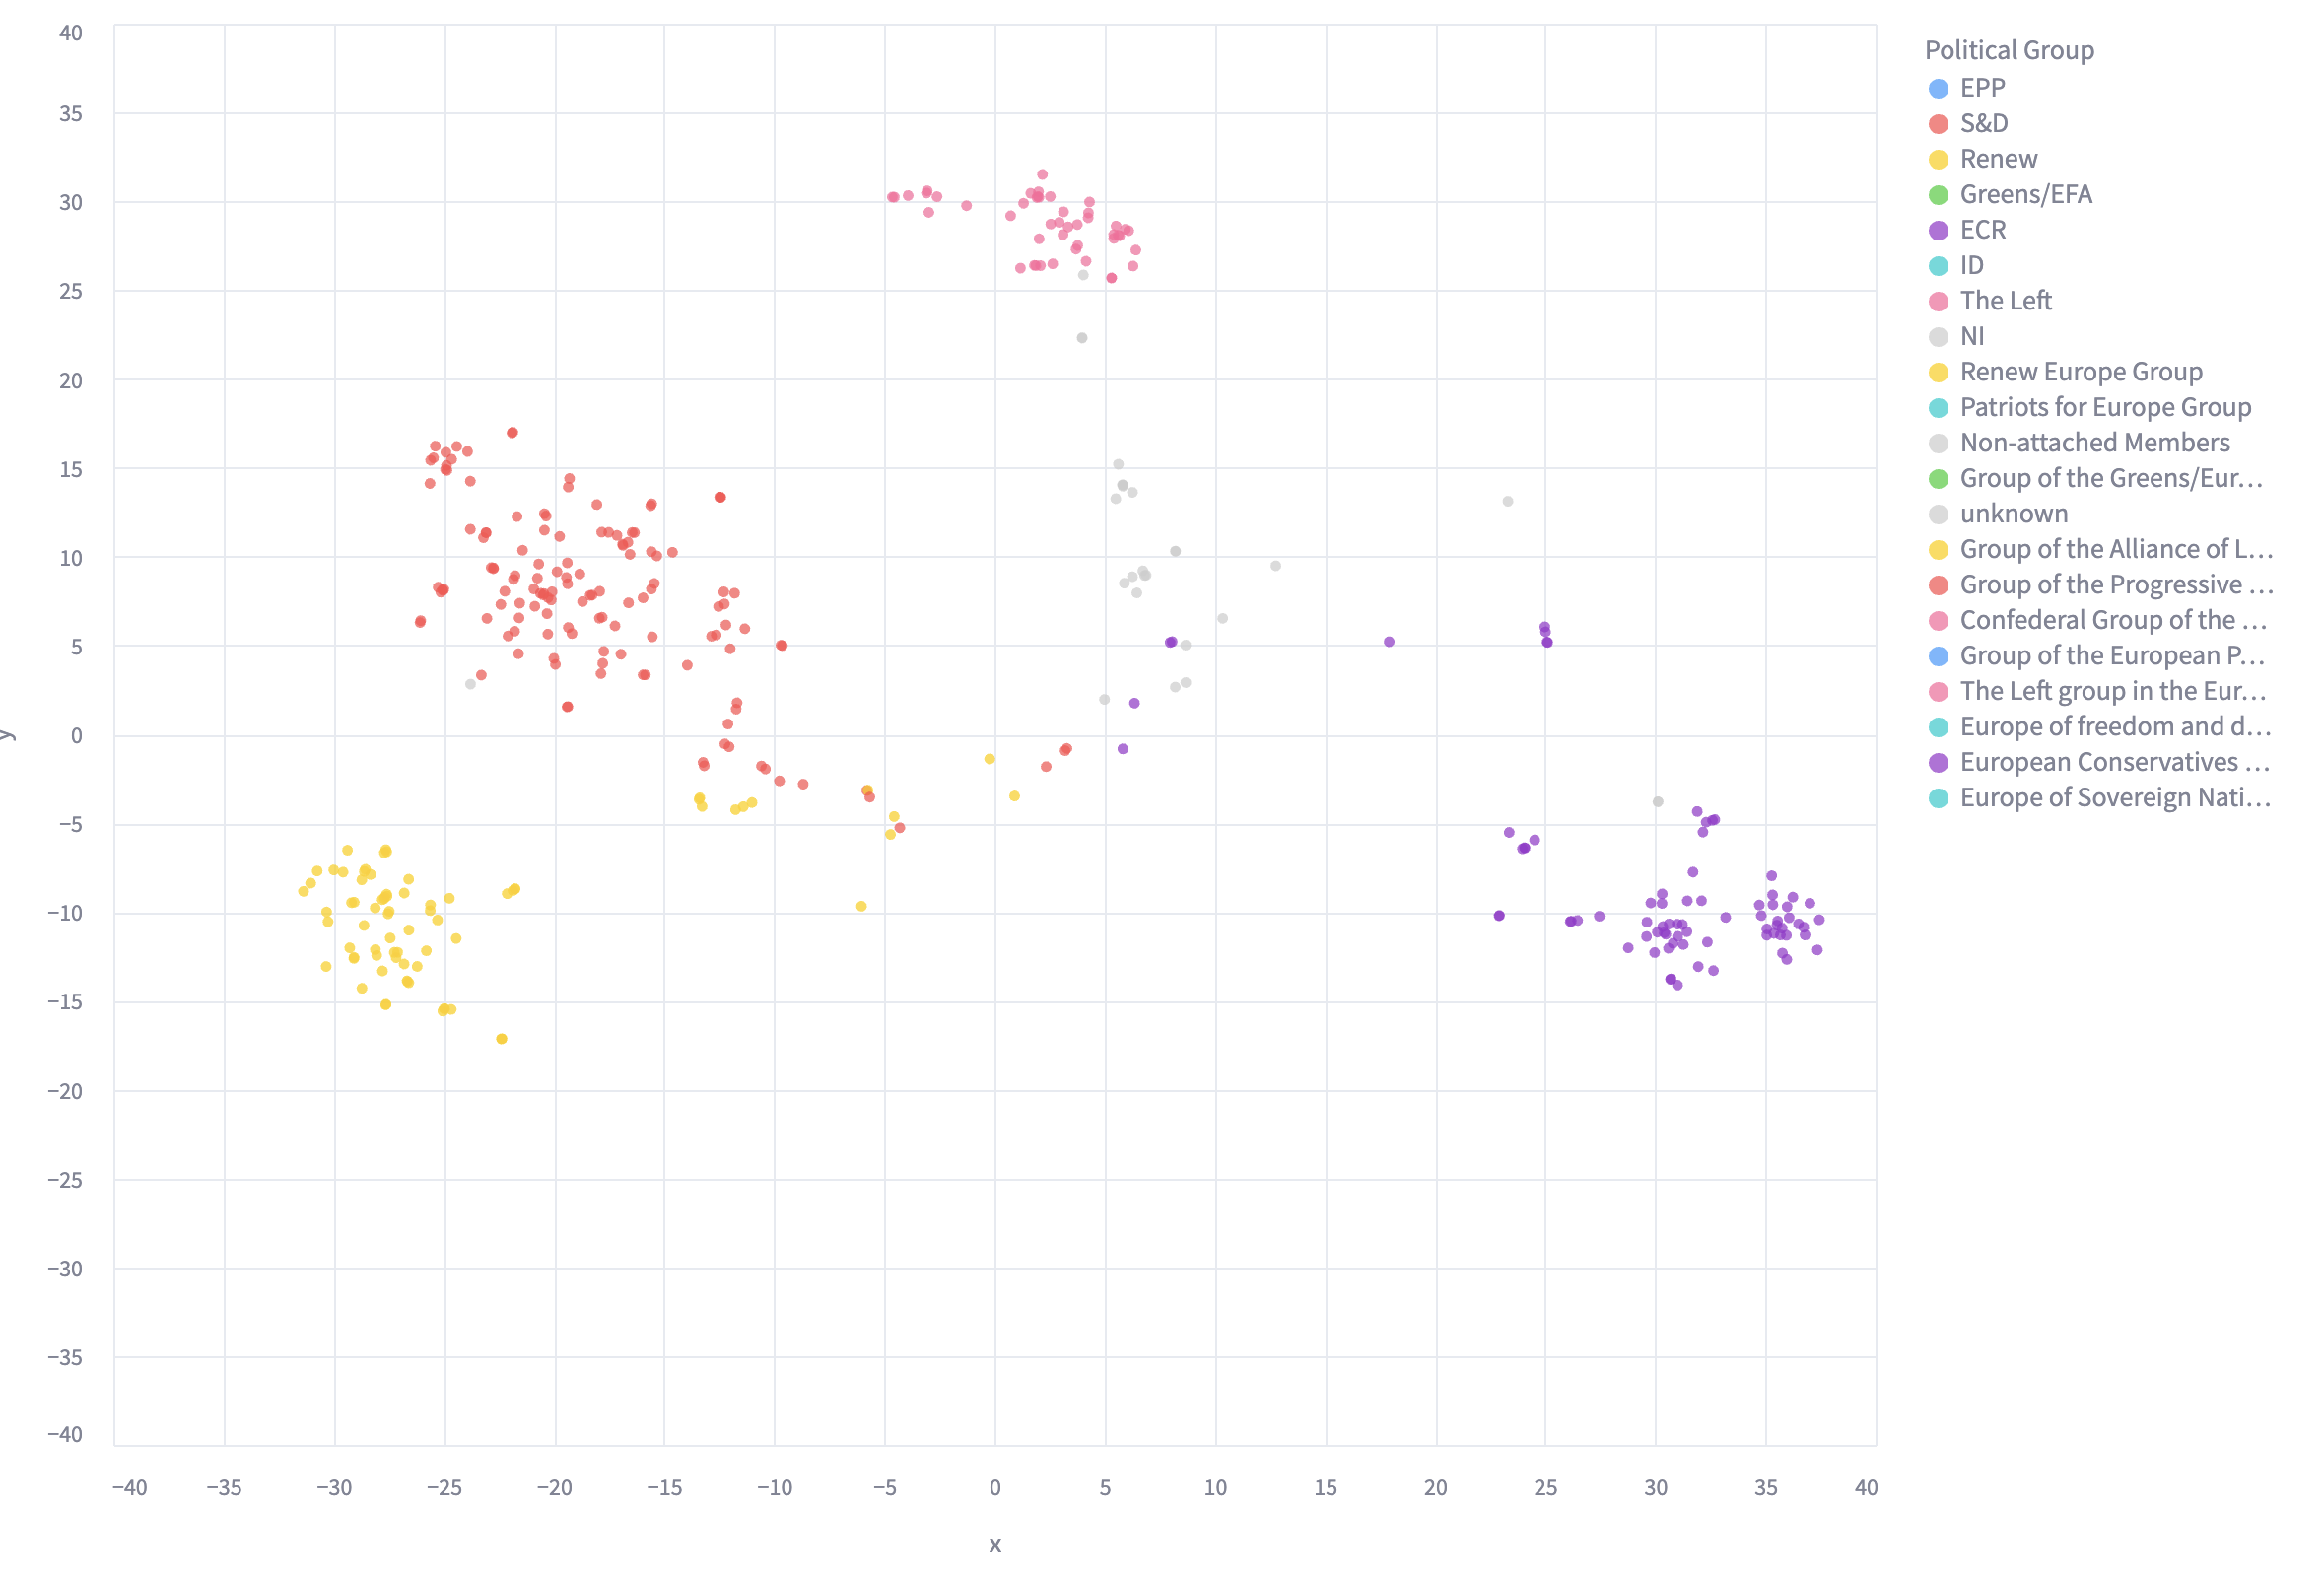
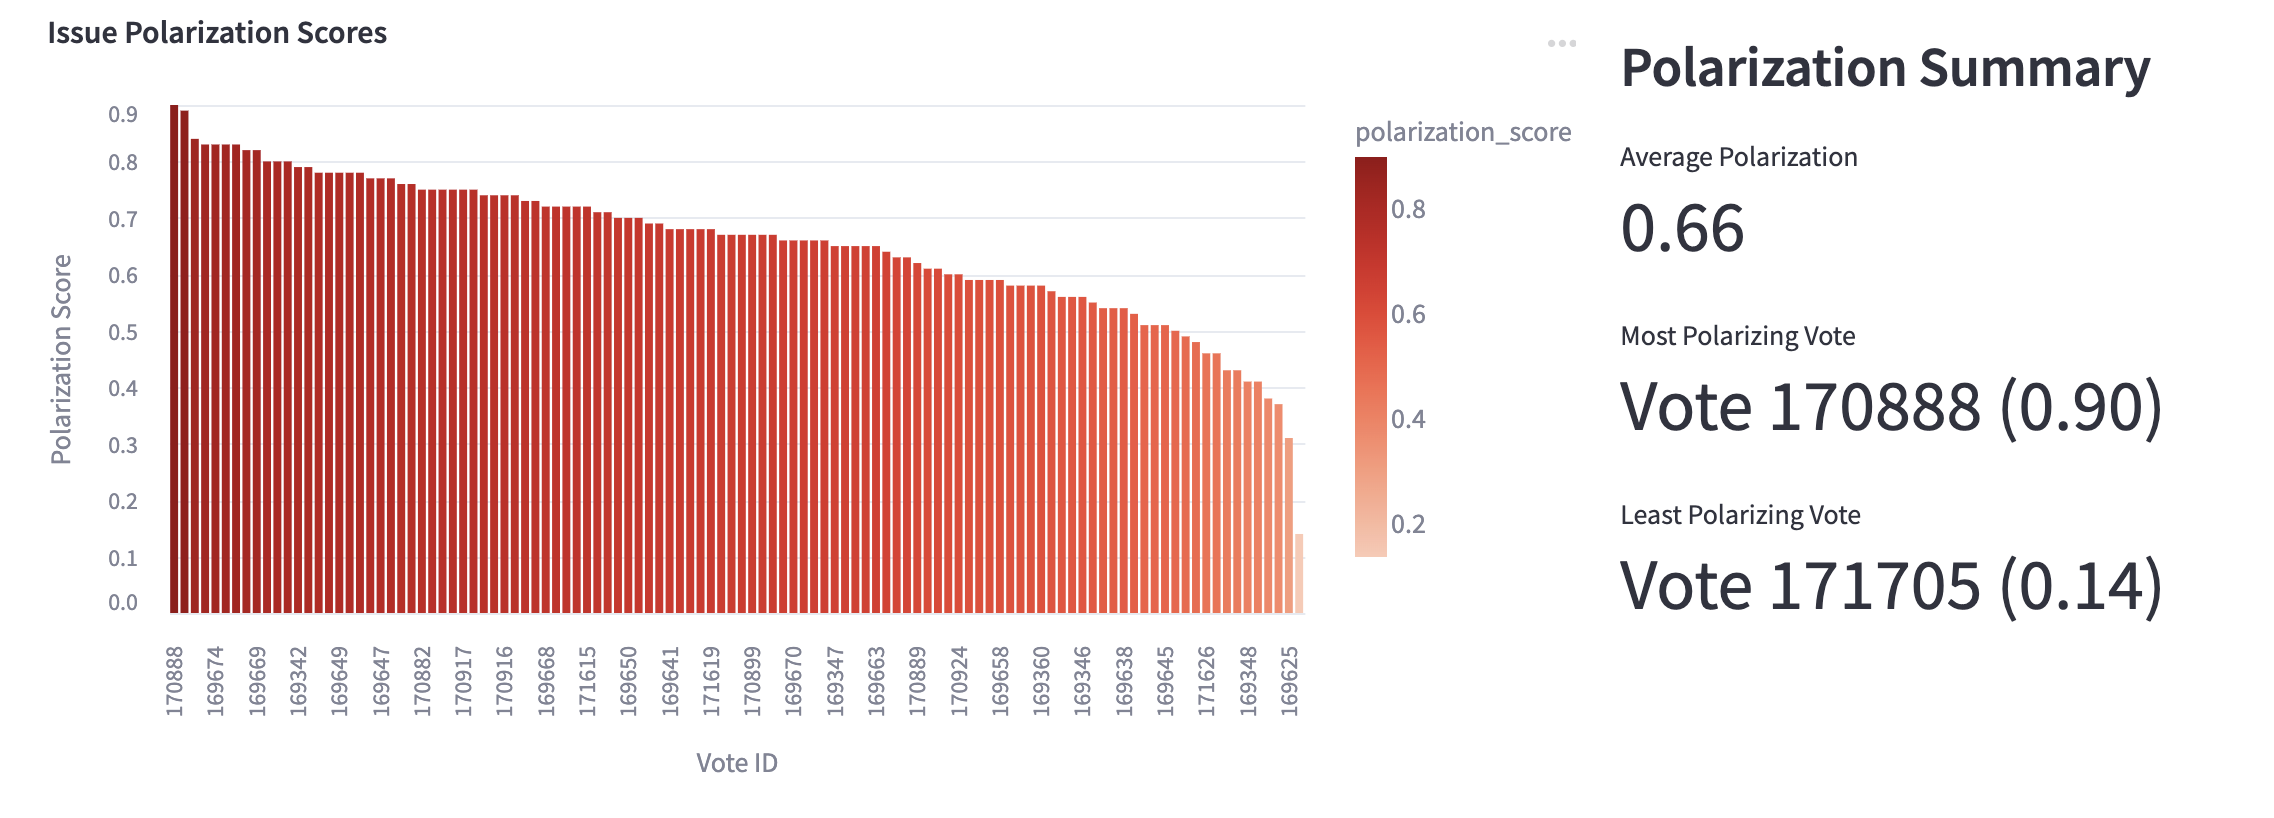
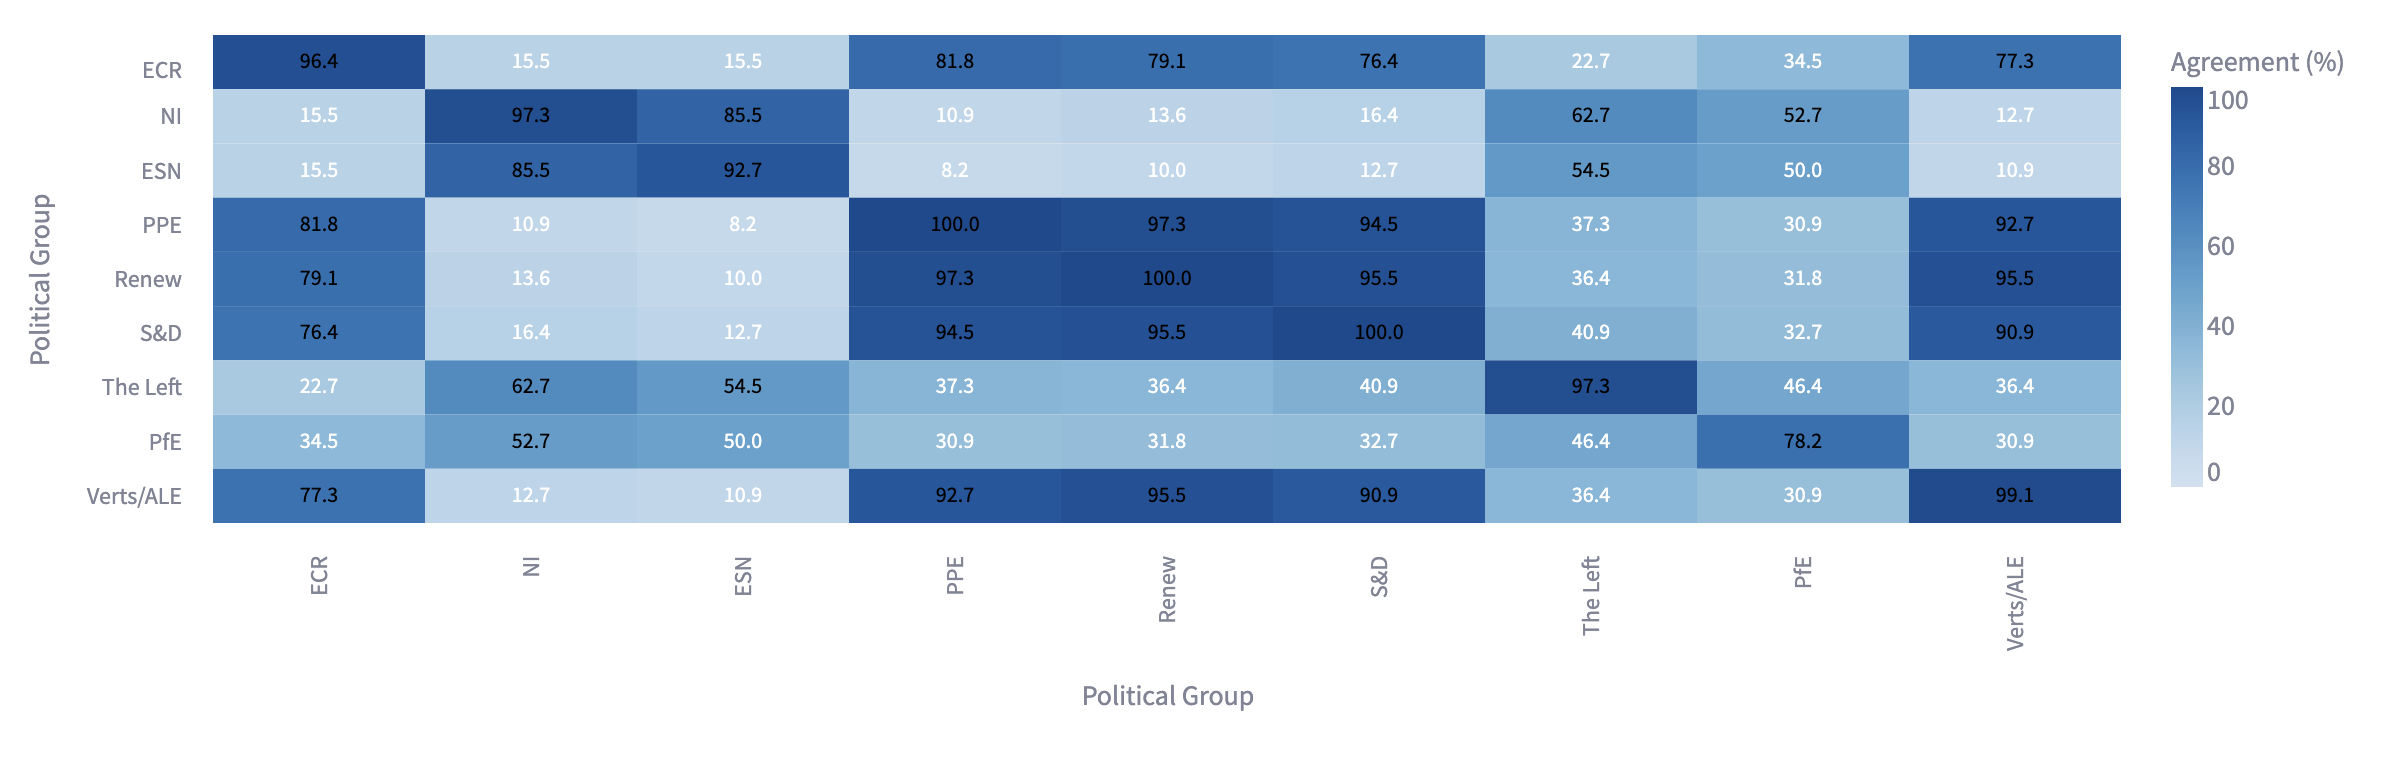
Researchers, journalists, and EU affairs professionals use MEPMap to decode voting patterns across the European Parliament. Search any policy topic, see which MEPs align, spot cross-party coalitions, and track polarization — all backed by 16 million votes from 5 legislatures.